The mechanical failure of amorphous systems is not well understood, but recent work by Liu and co-workers suggests that low-frequency vibrational modes are concentrated in localized regions, or “soft spots,” that are prone to rearrange. Yodh and Liu experimentally studied the nature of soft spots in crystalline and amorphous packings of colloidal spheres. In crystals [1], they found soft spots to be concentrated on topological defects such as grain boundaries and dislocations that are well known to serve as flow defects in crystals. This observation further confirmed that soft spots may be specific indicators of precisely the types of defects that can lead to larger scale material deformation (Fig. 1).
![figure Fig. 1. (a) Snapshot of PNIPAM colloidal polycrystal with a grain boundary; the scale bar is 10 μm. (b) Color contour plots indicate soft spots that correlate well with “defect” particles identified by local structural parameters [1].](/sites/default/files/u63/highlight_2.14_irg3_1.jpg)
Fig. 1. (a) Snapshot of PNIPAM colloidal polycrystal with a grain boundary; the scale bar is 10 μm. (b) Color contour plots indicate soft spots that correlate well with “defect” particles identified by local structural parameters [1].
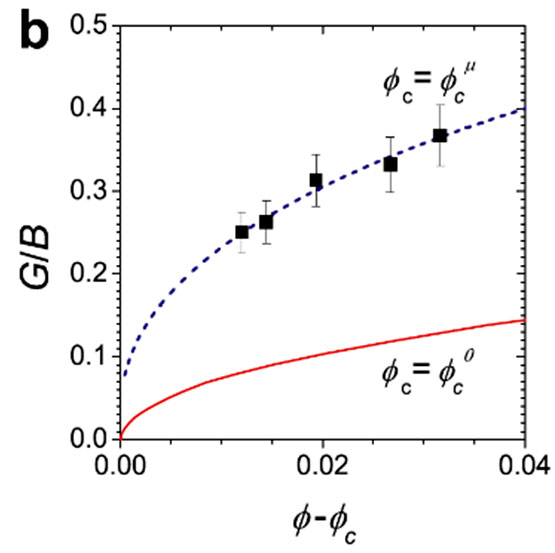
In colloidal glasses [2], Yodh and Liu employed similar phonon analyses to extract the ratio of shear to bulk moduli, G/B, a parameter that appears to be a key parameter controlling the toughness of metallic glasses (Fig. 2). Interestingly, the data show unambiguously that static friction between particles—usually neglected in colloids—must be included.

Fig. 2. The ratio (G/B) of shear (G) and bulk (B) moduli of soft colloidal glasses at different packing fractions (i.e., as function of distance to the jamming transition, f-fc.) The dashed curve shows the prediction for frictional particles; for frictionless particles (solid curve), theory cannot capture experimental G/B.